Diabetes prediction using machine learning
The diabetes dataset is widely used in machine learning and data analysis. The dataset comprises medical information about patients with diabetes and is frequently used to predict whether or not a patient has diabetes based on clinical criteria.
The dataset contains information on 768 patients, 8 medical predictors, and an outcome variable that indicates whether or not the patient has diabetes.
The predictors are:
Pregnancies: How many times have you been pregnant
Glucose: Plasma glucose levels after 2 hours of an oral glucose tolerance test.
Blood pressure: Diastolic blood pressure (mm Hg).
Skin Thickness: Triceps skin fold thickness (mm)
Insulin: 2-hour serum insulin (mU/mL)
BMI is calculated as weight in kilograms divided by height in meters squared.
Diabetes-Pedigree-Function: Diabetes Pedigree Function
Age: in years.
The outcome variable is binary, with 1 indicating that the patient has diabetes and 0 indicating that the patient does not have diabetes. The dataset is often used in machine learning projects for predicting diabetes and can also be used for data analysis and visualization. It is a widely used dataset in the field of healthcare and is an important resource for researchers and data scientists working on diabetes-related projects.
Background of the Study
Diabetes is a chronic medical disorder signified by high blood sugar levels. Diabetes has a long history, and our understanding and treatment of disease have changed dramatically over time.
Here is a brief history of diabetes.
Ancient Egypt: Diabetes symptoms were initially described in ancient Egypt around 1550 BCE. It represented a condition known as “too much emptying of the urine.”
Ancient India: Diabetes was first discovered and classified by Indian physicians as madhumeha (meaning “honey urine”) and vridhameha (meaning “large urine”). They also noticed that diabetics had a sweet taste in their urine.
Ancient Greece and Rome: In the 2nd century AD, Greek physician Aretaeus of Cappadocia described the disease as “diabetes”, which means “to pass through” in Greek, referring to the excessive urine output. In the 1st century AD, Roman physician Celsus recommended a diet low in carbohydrates and fibre for treating diabetes.
Middle Ages: During this time, there was little progress in understanding diabetes. The sweet taste in the urine still identified it, which was thought to be caused by too much food and drink.
18th and 19th centuries: In 1776, English physician Matthew Dobson discovered that sugar was present in the urine of people with diabetes. In 1889, German physician Oskar Minkowski found that removing the pancreas from a dog caused the dog to develop diabetes. In 1869, Paul Langerhans identified the clusters of cells within the pancreas that produce insulin, which was later discovered to be the hormone responsible for regulating blood sugar.
20th century: In 1921, Canadian scientists Frederick Banting and Charles Best discovered insulin, which became the first effective treatment for diabetes. In 1959, the oral medication tolbutamide was approved for diabetes treatment. In 1982, the first biosynthetic human insulin was produced. In the late 1990s, the first oral medication for type 2 diabetes, metformin, was introduced.
21st century: Diabetes continues to be a significant health problem worldwide, and research in genetics, cell biology, and technology are advancing the understanding and treatment of diabetes. In 2020, the first “artificial pancreas” system was approved for use in people with type 1 diabetes.
Diabetes is now recognized as a complex condition that requires regular treatment to avoid long-term problems.
There are two forms of diabetes: type 1 and type 2.
Type 1 diabetes, which usually appears in childhood or adolescence, is an autoimmune illness in which the immune system targets and destroys insulin-producing cells in the pancreas.
Type 2 diabetes, which is more frequent and usually appears in adulthood, happens when the body becomes insulin resistant or does not create enough insulin to maintain normal blood sugar levels.
Other types of diabetes include gestational diabetes, which develops during pregnancy, and uncommon genetic variants of diabetes.
Diabetes can cause a variety of health consequences, including heart disease, renal disease, nerve damage, and blindness. Treatment typically involves managing blood sugar levels through diet, exercise, medication, and insulin therapy.
Prevention efforts for type 2 diabetes include maintaining a healthy weight, exercising regularly, and following a healthy diet. Early diagnosis and effective management are critical for preventing long-term complications and improving outcomes for people with diabetes.
Diagrams explain the Objectives
Here are some diagrams and tables to explain the area/domain of the diabetes dataset.
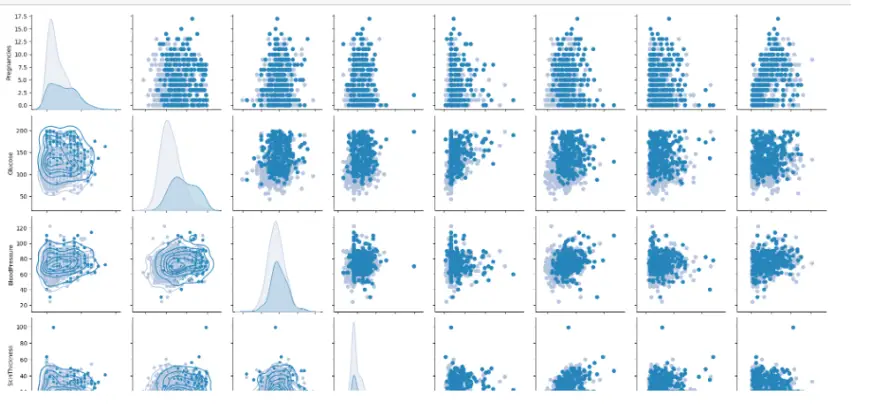
Scatterplot matrix
A scatterplot matrix can be utilized to show the relationships between the variables in the diabetes dataset. The diagonal represents the distribution of each variable, but the off-diagonal parts define the pairwise relationships between them.
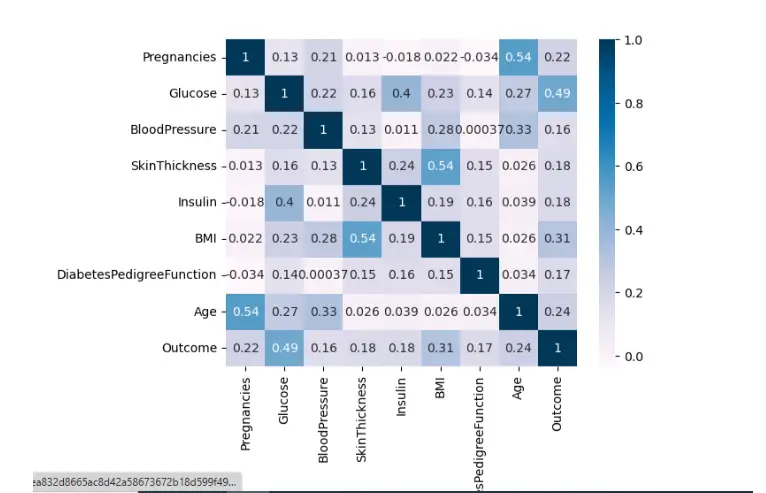
Correlation matrix
A correlation matrix shows the pairwise correlations among the variables in the dataset. The correlation coefficient goes from -1 to 1:
- -1 means a perfect negative correlation.
- 0 shows no association.
- 1 indicates a perfect positive correlation.
The scatterplot matrix and correlation matrix reveal that there are some correlations between the variables. For example, there is a positive relationship between glucose levels and the outcome variable, meaning that greater glucose levels are associated with an increased risk of diabetes.
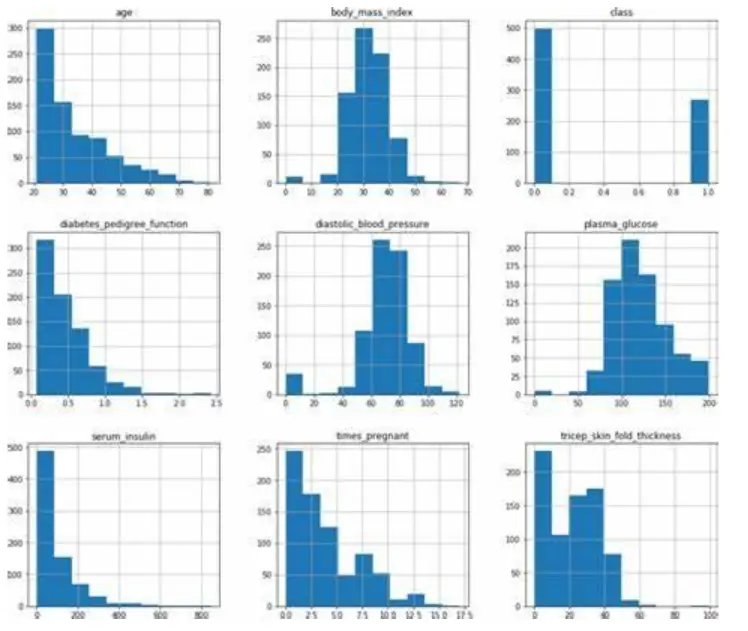
Histograms
Histograms can be used to visualize the distribution of each variable in the dataset.
From the histograms, we can see that some of the variables, such as blood pressure and BMI, are normally distributed, while others, such as insulin and skin thickness, have skewed distributions.
Summary statistics
Summary statistics can be used to summarize the central tendency, variability, and distribution of each variable in the dataset.
Variable | Mean | Standard deviation | Minimum | Maximum |
Pregnancies | 3.85 | 3.37 | 0 | 17 |
Glucose | 120.89 | 32.00 | 0 | 199 |
Blood Pressure | 69.10 | 19.36 | 0 | 122 |
Skin Thickness | 20.54 | 15.95 | 0 | 99 |
Insulin | 79.80 | 115.21 | 0 | 846 |
BMI | 31.99 | 7.88 | 0 | 67.1 |
Diabetes Pedigree Function | 0.47 | 0.33 | 0.08 | 2.42 |
Age | 33.24 | 11.76 | 21 | 81 |
From the summary statistics, we can see that the range of values for each variable varies widely. For example, the range of insulin values is from 0 to 846, while the range of age values is from 21 to 81. This indicates that the variables in the dataset have different units and scales, which may need to be normalized or scaled before being used in a machine learning model.
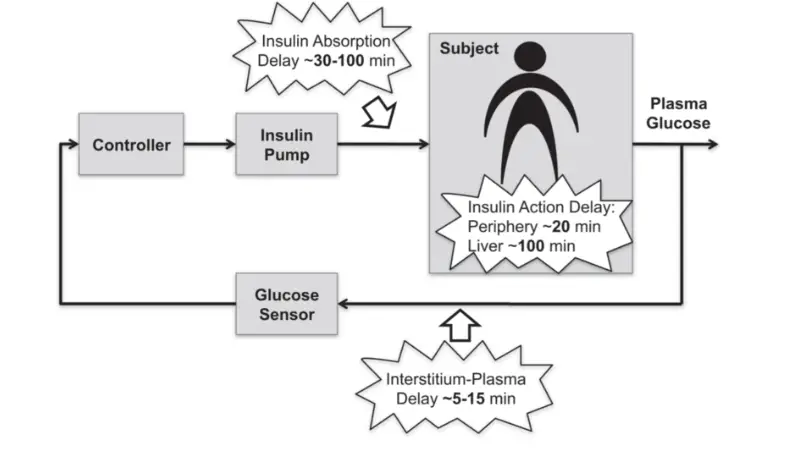
block diagram of closed-loop glucose control
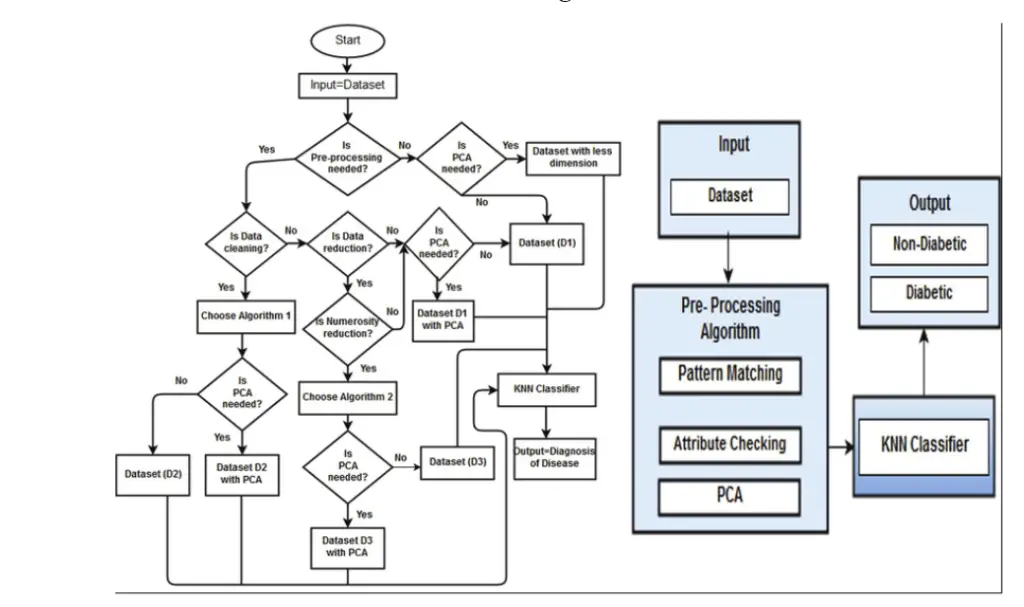
Flow-Chart and-Block Diagram of Proposed Methodology for Diabetes Diagnosis
Expected outcomes
The predicted outcome of the diabetes dataset is determined by the specific goal of the analysis or machine learning model being constructed.
Suppose the goal is to create a predictive model to categorize patients as diabetic or not based on their medical data. In that case, the desired output is a model that accurately predicts a patient’s risk of having diabetes based on their medical records. The model’s accuracy would be assessed using assessment measures such as accuracy, precision, recall, and F1 score.
If the goal is to identify the correlations between the variables in the dataset, the predicted consequence is understanding the risk factors for diabetes. For example, the analysis might reveal that higher glucose levels, higher BMI, and older age are associated with a higher risk of diabetes. These insights could be used to develop interventions or preventative measures to reduce the risk of diabetes.
In summary, the expected outcome of the diabetes dataset would depend on the specific goal of the analysis or machine learning model being developed. The goal should be clearly defined, and the study should be designed to achieve that goal.
Feature Extraction Techniques
Numerous feature extraction strategies can be utilized with the diabetes dataset. Here are some common techniques:
Principal Component Analysis (PCA): PCA is a technique for reducing dimensionality in data by identifying the most essential elements. This can assist in identifying the most critical factors that lead to diabetes.
Recursive Feature Elimination (RFE): RFE is a strategy for identifying the most relevant features for a given task. It progressively reduces the least significant characteristics until the required features are obtained.
Mutual Information: Mutual information refers to the quantity of information shared by two variables. It can be used to determine which characteristics are most associated with diabetes.
Correlation: Correlation determines the strength of the relationship between two variables. It can be used to identify the most correlated features with diabetes.
Select K Best: Select K Best is a technique that selects the top K features based on statistical tests. It can be used to identify the most relevant features of diabetes.
These techniques can be used individually or in combination to extract the most essential features from the diabetes dataset.
Different ML models Evaluation of the Models Conclusion
Various machine learning (ML) models are available, and each model has strengths and weaknesses. Evaluating the performance of these models is crucial in determining which model is best suited for a particular problem.
Here are some commonly used ML models and how they are evaluated:
Linear Regression: Linear regression is evaluated based on the mean squared error (MSE) or the root mean squared error (RMSE) between the predicted and actual values.
Logistic Regression: Logistic regression is evaluated based on the accuracy of the predictions, as well as metrics like precision, recall, and F1 score.
Decision Trees: Decision trees are evaluated based on accuracy, precision, recall, F1 score, and the area under the receiver operating characteristic (ROC) curve.
Random Forests: Random forests are evaluated using similar metrics as decision trees but may also be assessed using feature importance rankings.
Support Vector Machines (SVMs): SVMs are evaluated based on accuracy, precision, recall, F1 score, and the area under the ROC curve.
Neural Networks: Neural networks are evaluated based on accuracy, precision, recall, F1 score, and the area under the ROC curve. They may also be assessed based on loss and validation accuracy during training.
In conclusion, evaluating the performance of ML models is essential to choosing the best model for a particular problem. Different models are estimated using other metrics and selecting the appropriate metrics for the issue is necessary. Additionally, it is often helpful to compare multiple models’ performance to determine which is the most suitable.
Diabetes prediction using machine learning with Source Code
Yes, machine learning models excel at early-stage prediction by analyzing various risk factors. This proactive approach allows individuals to take preventive measures before symptoms manifest.
Machine learning models have shown remarkable accuracy in predicting diabetes, with some achieving up to 90% precision. However, the accuracy may vary depending on the complexity of the model and the quality of the input data.
Yes, ethical concerns, particularly regarding data privacy and model interpretability, are significant. Striking a balance between harnessing the power of machine learning and protecting individual privacy is an ongoing challenge.

Final Year Projects

Data Science Projects

Blockchain Projects

Python Projects

Cyber Security Projects

Web dev Projects

IOT Projects

C++ Projects
-
Where Do YouTubers Get Their Music?
-
Top 20 Machine Learning Project Ideas for Final Years with Code
-
Why Creators Choose YouTube: Exploring the Four Key Reasons
-
10 Advance Final Year Project Ideas with Source Code
-
10 Deep Learning Projects for Final Year in 2024
-
AI Music Composer project with source code
-
Realtime Object Detection
-
30 Final Year Project Ideas for IT Students
-
E Commerce sales forecasting using machine learning
-
Stock market Price Prediction using machine learning
-
c++ Projects for beginners
-
Python Projects For Final Year Students With Source Code
-
20 Exiciting Cyber Security Final Year Projects
-
10 Web Development Projects for beginners
-
Fake news detection using machine learning source code
-
Top 10 Best JAVA Final Year Projects
-
15 Exciting Blockchain Project Ideas with Source Code
-
C++ Projects with Source Code
-
Artificial Intelligence Projects For Final Year
-
Hand Gesture Recognition in python
