Stock market Price Prediction using machine learning

In the world of finance, predicting stock prices has always been a challenging task. Investors are always seeking innovative tools to navigate the unpredictable stock market. Machine Learning (ML) is a ground-breaking technology that has brought about significant changes in various industries, including finance. In this article, we will explore a Stock market Price Prediction using machine learning. We will explain how it works, its impact and how can we make this project in Python. Source code is also available for Stock market Price Prediction.
What is Stock Price Prediction system?
A Stock Price Prediction System is like a smart tool that uses special machine learning to predict where the stock market is going. It looks at old stock data, figures out what details matter, and learns from them. This helps people who invest money in stocks to decide if they should buy or sell. The steps involve gathering and fixing old stock information, picking out the important parts, and choosing a computer method to learn from it all. After the computer learns, it can guess what might happen next in the stock market. But remember, even with these tools, the stock market is tricky and can surprise us. So, predictions aren’t always spot on.
How Stock Price Prediction using machine learning works?
Design a user friendly interface with elegant images. Add input fields where user can enter name of stock. when user enter stock your system should give output and predict the price of that stock.Accuracy is very important so accuracy of this system which I implemented is 86%.So for user prediction with accuracy matters.
On the other hand there is machine learning at backend.First, historical stock data, including opening and closing prices, volume traded, and other financial indicators, is collected. This data is then cleaned and normalized to ensure accuracy. Relevant features influencing stock prices, such as trends and technical indicators, are selected. A suitable machine learning model, like linear regression or decision trees, is chosen. The model is trained on historical data, learning patterns and relationships. After training, the model is validated and tested on separate datasets to ensure its ability to make accurate predictions.
Real-world Applications of Stock market Price Prediction using Machine Learning
Algorithmic Trading
Machine learning has greatly affected algorithmic trading. In algorithmic trading has pre-defined criteria where automated systems make trades. These algorithms analyze market conditions in real time, making quick decisions to maximize profits and reduce risks.
Portfolio Management
For managing portfolios investment firms are using machine learning. With the help of these systems improve portfolios by finding the best mix of assets, balancing risk and return for the best outcomes.
Sentiment Analysis
For predicting stock prices understanding market sentiment is very important. With the help of machine learning models analyze news articles, social media, and financial reports to determine public sentiment and provide insights on market trends.
Challenges and Opportunities of Stock market Price Prediction using machine learning
The Complexities in Prediction
Although machine learning presents a lot of opportunities, there are still some challenges associated with it. For example, the market is constantly changing, and unpredictable events such as geopolitical disturbances or sudden economic shifts can disrupt traditional models. However, machine learning systems have the ability to continuously adapt by learning from new data and adjusting their predictions accordingly.
Burstiness in Financial Markets
Financial markets change quickly, with sudden big changes up or down. This is a big challenge for machine learning models. They need to be able to handle fast changes and make accurate predictions, even in turbulent conditions.
Balancing Specificity and Context
Finding the right balance between specificity and context is important. To accurately predict individual stock outcomes, it is crucial to have machine learning models that are simple to understand the specific characteristics of each stock. However, they also need to consider the overall market situation to avoid making limited decisions.
Stock market Price Prediction using machine learning in Python
Creating a stock market prediction using machine learning is simple. It is not difficult you just need to follow these steps. Before going to steps download Tesla Stocks Dataset here.
Step 1: Import Libraries
				import pandas as pd
import numpy as np
import matplotlib.pyplot as plt
import chart_studio.plotly as py
import plotly.graph_objs as go
from plotly.offline import plot
from sklearn.model_selection import train_test_split
from sklearn.preprocessing import StandardScaler
from sklearn.metrics import mean_squared_error as mse
from sklearn.metrics import r2_score
from sklearn.linear_model import LinearRegression
This step imports necessary libraries for data manipulation (Pandas and NumPy), visualization (Matplotlib, Plotly), machine learning model (Linear Regression), and evaluation metrics.
Step 2: Read and Preprocess Data
				Tesla_data = pd.read_csv('tesla.csv')
Head_data = Tesla_data.head()
Tesla_data['Date'] = pd.to_datetime(Tesla_data['Date'])
Here, it reads a CSV file (‘tesla.csv’) into a Pandas DataFrame, displays the first few rows, and converts the ‘Date’ column to a datetime format.
Step 3: Display Information about the Data
				print(f'Dataframe contains stock prices between {Tesla_data.Date.min()} {Tesla_data.Date.max()}')
print(f'Total days = {(Tesla_data.Date.max() - Tesla_data.Date.min()).days} days')
This prints information about the data, including the range of dates and the total number of days.
Step 4: Box Plot for Stock Prices
Tesla_data[['Open', 'High', 'Low', 'Close', 'Adj Close']].plot(kind='box')
This creates a box plot to visualize the distribution of stock prices.
Step 5: Set Layout for the Plot
				layout = go.Layout(
    title='Stock Prices of Tesla_data',
    xaxis=dict(
        title='Date',
        titlefont=dict(
            family='Courier New, monospace',
            size=18,
            color='#7f7f7f'
        )
    ),
    yaxis=dict(
        title='Price',
        titlefont=dict(
            family='Courier New, monospace',
            size=18,
            color='#7f7f7f'
        )
    )
)
This defines the layout for Plotly visualizations, including the title and axis titles.
Step 6: Plot Stock Prices using Plotly
				Tesla_data_data = [{'x': Tesla_data['Date'], 'y': Tesla_data['Close']}]
plot1 = go.Figure(data=Tesla_data_data, layout=layout)
This creates a Plotly figure for visualizing stock prices over time.
Step 7: Split Data into Train and Test Sets
				X = np.array(Tesla_data.index).reshape(-1, 1)
Y = Tesla_data['Close']
X_train, X_test, Y_train, Y_test = train_test_split(X, Y, test_size=0.3, random_state=101)
This splits the data into training and testing sets for model training and evaluation.
Step 8: Feature Scaling
scaler = StandardScaler().fit(X_train)
The FPS counter is stopped, and elapsed time and approximate FPS are printed to the console.
Step 9: Create a Linear Model
				lm = LinearRegression()
lm.fit(X_train, Y_train)
This creates a linear regression model and fits it to the training data.
Step 10: Plot Actual and Predicted Values for Train Dataset
				trace0 = go.Scatter(x=X_train.T[0], y=Y_train, mode='markers', name='Actual')
trace1 = go.Scatter(x=X_train.T[0], y=lm.predict(X_train).T, mode='lines', name='Predicted')
plot2 = go.Figure(data=[trace0, trace1], layout=layout)
This creates a Plotly figure showing actual and predicted values for the training dataset.
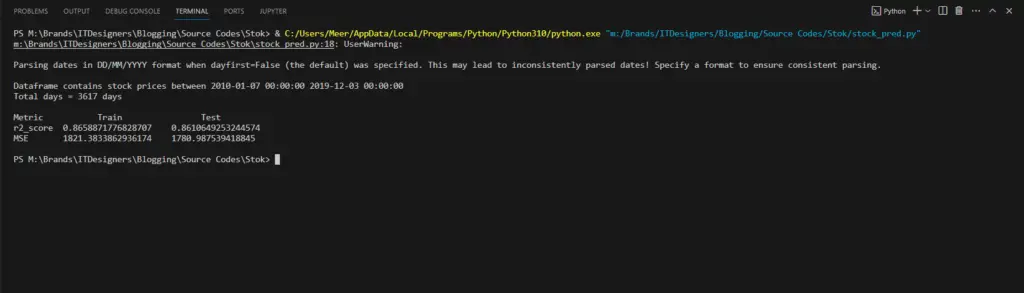
Step 11: Calculate Scores for Model Evaluation
				scores = f'''
{'Metric'.ljust(10)}{'Train'.center(20)}{'Test'.center(20)}
{'r2_score'.ljust(10)}{r2_score(Y_train, lm.predict(X_train))}\t{r2_score(Y_test, lm.predict(X_test))}
{'MSE'.ljust(10)}{mse(Y_train, lm.predict(X_train))}\t{mse(Y_test, lm.predict(X_test))}
'''
print(scores)
This calculates and prints evaluation metrics such as R-squared and Mean Squared Error for the linear regression model on both the training and testing sets.
The overall purpose of this code is to load, visualize, and evaluate the stock prices for Tesla using a linear regression model.
Output
To learn more about Stock Price Prediction:
Machine learning models can detect patterns that may precede market crashes, offering early warnings. However, predicting the exact timing and magnitude remains challenging.
Ethical considerations include biased algorithms and the potential for market manipulation. Ongoing research and industry regulations aim to address these concerns.
Regular updates are essential to ensure models adapt to changing market conditions. The frequency depends on the volatility of the market and the specific requirements of the model.

Final Year Projects

Data Science Projects

Blockchain Projects

Python Projects

Cyber Security Projects

Web dev Projects

IOT Projects

C++ Projects
-
Where Do YouTubers Get Their Music?
-
Top 20 Machine Learning Project Ideas for Final Years with Code
-
Why Creators Choose YouTube: Exploring the Four Key Reasons
-
10 Advance Final Year Project Ideas with Source Code
-
10 Deep Learning Projects for Final Year in 2024
-
E Commerce sales forecasting using machine learning
-
AI Music Composer project with source code
-
Realtime Object Detection
-
30 Final Year Project Ideas for IT Students
-
Stock market Price Prediction using machine learning
-
c++ Projects for beginners
-
Python Projects For Final Year Students With Source Code
-
20 Exiciting Cyber Security Final Year Projects
-
10 Web Development Projects for beginners
-
Fake news detection using machine learning source code
-
Top 10 Best JAVA Final Year Projects
-
15 Exciting Blockchain Project Ideas with Source Code
-
C++ Projects with Source Code
-
Artificial Intelligence Projects For Final Year
-
Hand Gesture Recognition in python
-
Best 21 Projects Using HTML, CSS, Javascript With Source Code
-
Credit Card Fraud detection using machine learning
-
How to Download image in HTML
-
10 advanced JavaScript project ideas for experts in 2024
-
Hate Speech Detection Using Machine Learning
-
How to Host HTML website for free?
-
20 Advance IOT Projects For Final Year in 2024
-
Python Projects For Beginners with Source Code
-
Plant Disease Detection using Machine Learning
-
10 Exciting C++ projects with source code in 2024
-
Data Science Projects with Source Code
-
Ethical Hacking Projects
-
Best Machine Learning Final Year Project
-
Top 7 Cybersecurity Final Year Projects in 2024
-
Best 13 IOT Project Ideas For Final Year Students
-
Top 13 IOT Projects With Source Code
-
Artificial Intelligence Projects for the Final Year
-
portfolio website using javascript
-
Phishing website detection using Machine Learning with Source Code
-
Fabric Defect Detection
-
10 Exciting Next.jS Project Ideas
-
17 Easy Blockchain Projects For Beginners
-
Heart Disease Prediction Using Machine Learning
-
How to Change Color of Text in JavaScript
-
Diabetes Prediction Using Machine Learning
-
Wine Quality Prediction Using Machine Learning
-
10 Final Year Projects For Computer Science With Source Code
-
Car Price Prediction Using Machine Learning
-
Step-By-Step Complete Guide Of Freelance Visa Abu Dhabi In 2024
-
South Africa Visa For UAE Residents: A Complete Guide
